

Check out the Q3 economic and market commentary with Chief Investment Officer Matthew Harbert from Instrumental Wealth.
Play the video recording, or see the transcript below organized by section & topic. Each topic has screenshots from the presentation.
Table of Contents:
- Introduction to Q3 Market Commentary
- Economic Challenges in Q3 (0:22)
- Overview of Markets in Q3 (01:28)
- S&P 500 Performance in Q3 (03:00)
- Housing Market in Q3 (04:15)
- Employment in Q3 (06:32)
- Hourly Earnings in Q3 (08:24)
- Inflation in Q3 (09:14)
- Federal Reserve Policy (11:08)
- The Big Question on Recession (12:22)
- Conclusion & Thank You
Introduction to Q3 Market Commentary
David Silver (00:00):
Hi everyone. I hope this finds everybody doing well today. I'm joined by Chief Investment Officer Matt Harbert to talk about the third quarter and the economic overview of what took place.
I know, Matt, a lot of our clients love hearing from you, so I'm going to go ahead and turn it over to you to walk through all of the things that took place in the third quarter.
Economic Challenges in Q3
Matthew Harbert (00:22):
Great. Thank you, Dave. For the third quarter, there have been several economic challenges.
First, the US lost another AAA rating on its debt. Fitch downgraded them from AAA to AA plus, citing a political standoff, poor fiscal management, and a high level of government debt that led into another potential government shutdown. They came up with a temporary solution to keep the government open, although the result was the house speaker was ousted.
We saw a spike in oil and gasoline prices where WTI (West Texas Intermediate) broke above $90 a barrel, Brent crude went over $95 a barrel, and the average gas price briefly topped $4 a gallon.
Geopolitically, we still have the war going on in Ukraine and, just after the quarter, there was the terror attack in Israel.
Overview of Markets in Q3
Matthew Harbert (01:28):
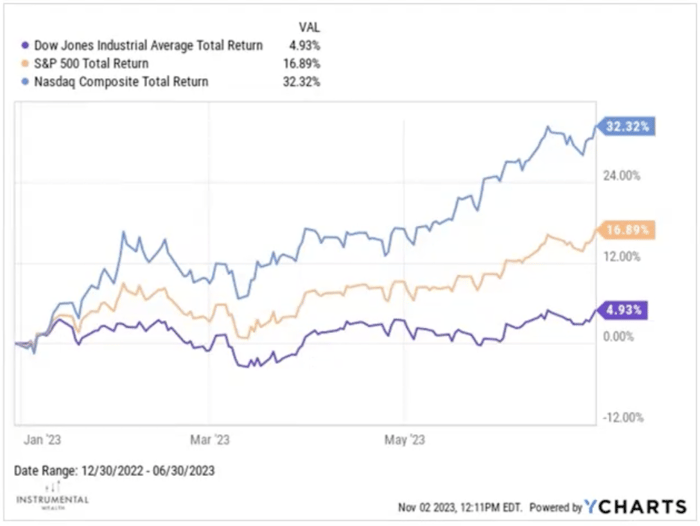
Graph is for illustrative purposes only.
In the markets, we had a pretty strong first half. As you can see in this chart, the S&P 500 returned about 16.9% over the first half, and then Nasdaq was up over 32%
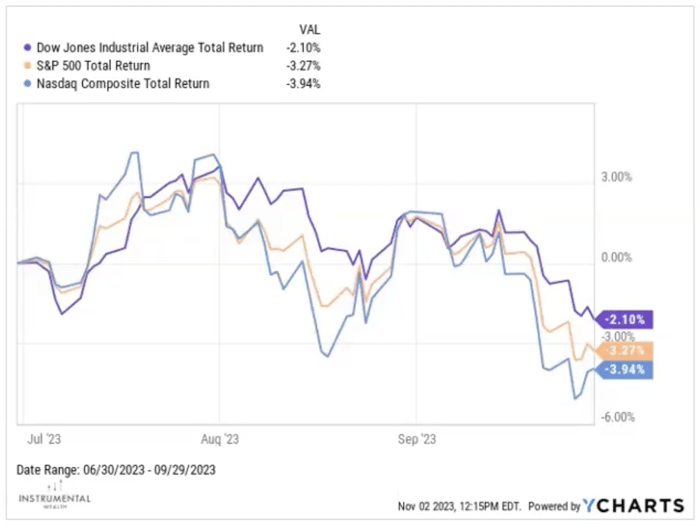
Graph is for illustrative purposes only.
Although investors became jittery in the third quarter, and it did pull back, with the S&P 500 down three and a quarter and the NASDAQ down almost 4%.
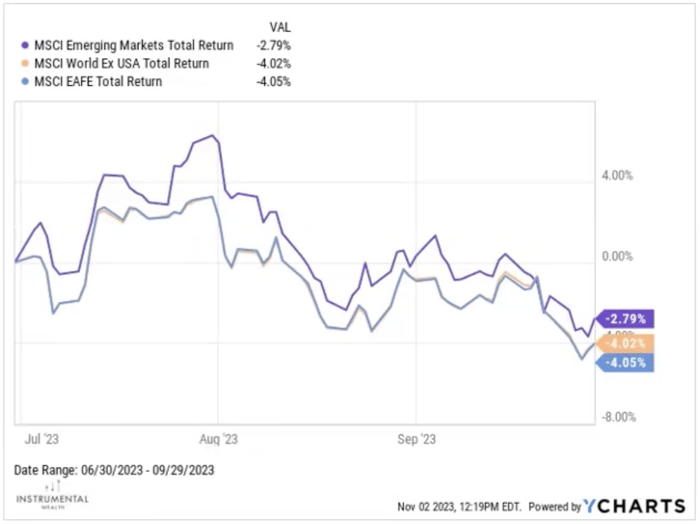
Graph is for illustrative purposes only.
The global markets were not immune to these fears either. Over the third quarter, the developed markets were down almost 4%, and the emerging markets were down two and three-quarters percent.
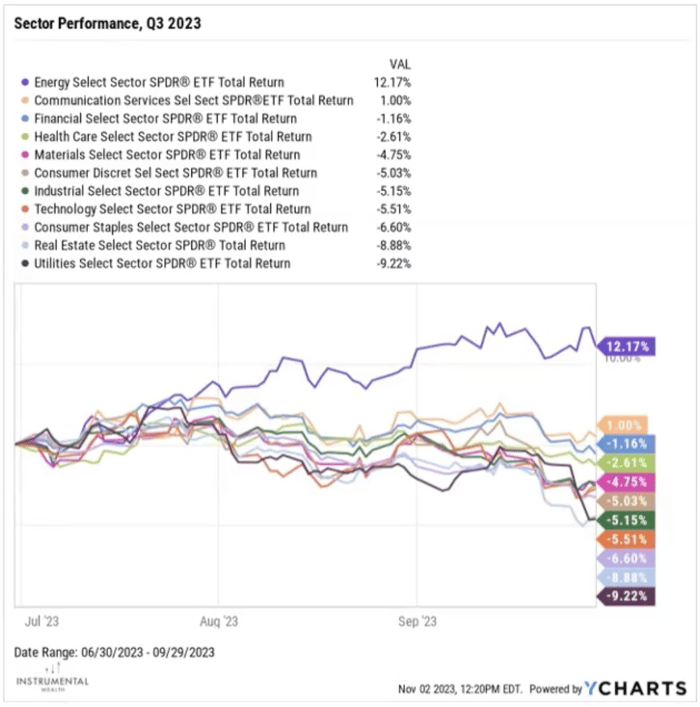
Graph is for illustrative purposes only. The ETFs shown are being used to show sectors in the S&P 500.
Looking at individual sectors within the S&P 500, the energy sector performed really well over the quarter, earning over 12%, which isn't a surprise given the spike in oil prices.
Communication services were up about a percent, but all nine other sectors were down, some very significantly, coming close to a 10% loss for that quarter.
S&P 500 Performance in Q3
Matthew Harbert (03:00)
Graph is for illustrative purposes only.
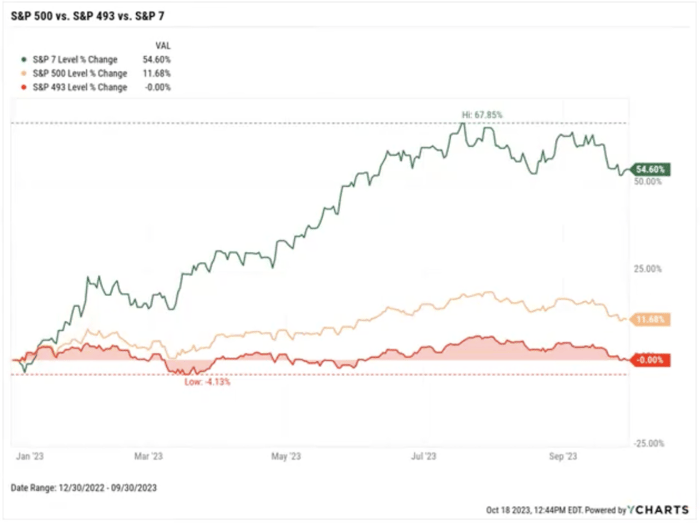
Interestingly, the S&P 500 performed quite well year to date as of September 30.
However, a small group of stocks - Apple, Amazon, Alphabet, Meta, Microsoft, Nvidia, and Tesla - were the seven stocks that drove that performance, called the Magnificent Seven.
For year to date up to September 30, those seven stocks performed a whopping 55%. But when you look at the other 493 stocks in the S&P 500, they're exactly 0% over the three quarters.
So, even after the pullback in the third quarter, the S&P 500 is up about 11.5%, but it's pretty much all driven by those seven stocks.
Housing Market in Q3
Matthew Harbert (04:15):
Graph is for illustrative purposes only.
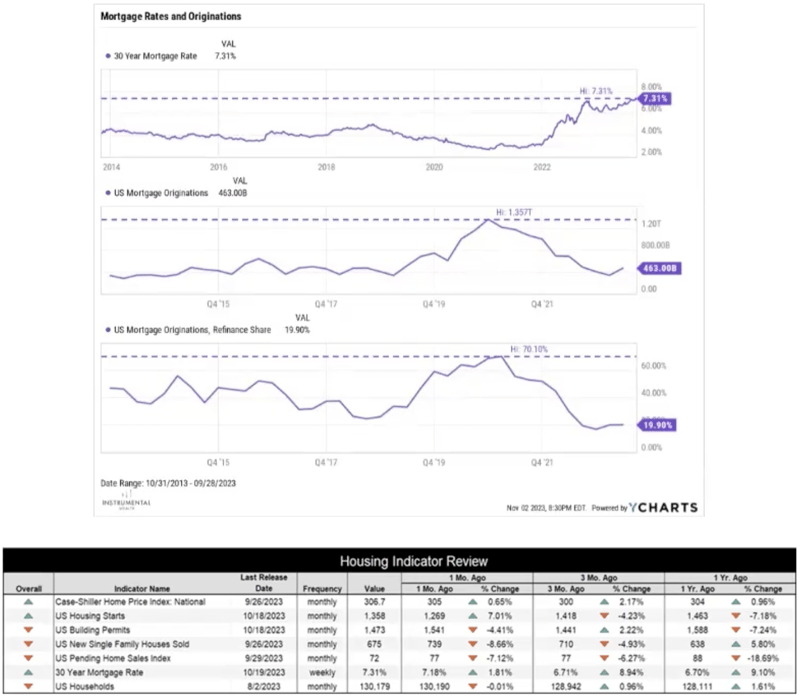
On the macroeconomic side of things, starting with the housing market, we're in the middle of correcting from a bubble that was created back in 2021 and 2022. In 2021, we had the lowest 30-year mortgage rate we've had in decades. However, since then, rates have skyrocketed and at the end of September 30, they had reached 7.3%. As of October 31, they have gone up even further to 7.8%.
You can see how mortgage originations as well as refinances have really tumbled, with originations falling from a high of 1.3 trillion down to 463 billion, and refinances from as high as 70% now below 20%.
With housing prices still elevated and mortgage rates skyrocketing, we're seeing a lot of the numbers starting to soften. Housing starts, new single-family houses sold, and pending houses sold are all down for the quarter. Permits are up for the quarter but down seven and a quarter from this time last year.
Employment in Q3
Matthew Harbert (06:32):
Graph is for illustrative purposes only.
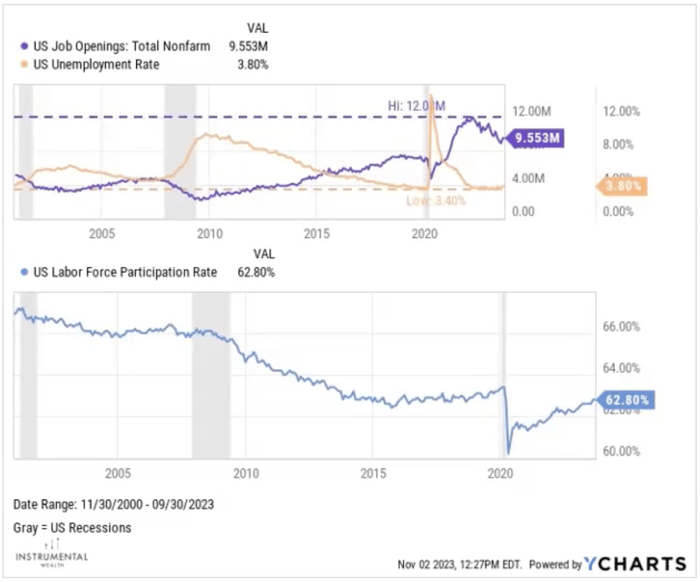
Moving on to employment, there's some normalization in the labor market as well. The labor force participation rate has been gradually falling since the early 2000s, primarily driven by the retirement of the baby boomer generation. But it plummeted due to the pandemic in 2020, and we've been recovering since. As of September 30, we're only six-tenths away from where we were pre-pandemic.
Employers have had a tough time getting job openings filled, so they've been very high. It reached a high of $12M in July of 2022. But they have been coming back down, and the unemployment rate continues to remain low. Payroll additions have also been pretty robust and strong.
The combination of these factors suggest that employees are returning to the workforce and employers have been successful in filling some of those open positions.
Hourly Earnings in Q3
Matthew Harbert (08:24):
Graph is for illustrative purposes only.
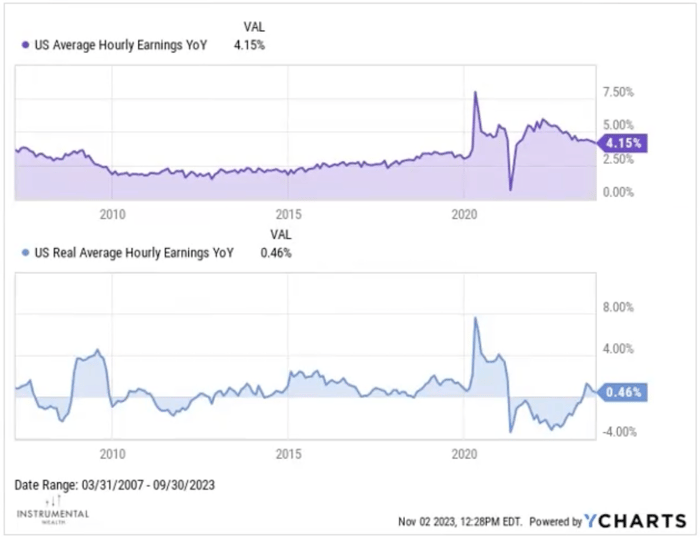
Hourly earnings have been declining since March of last year. However, real average hourly earnings, which are adjusted for inflation, have had five consecutive months of growth, turning around a trend that had been negative for 25 consecutive periods.
Inflation in Q3
Matthew Harbert (09:14):
Graph is for illustrative purposes only.
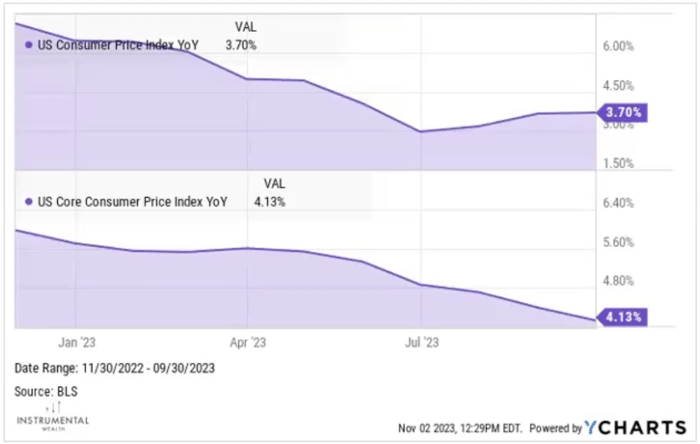
Inflation has been trending down though it's still elevated.
The Federal Reserve's target is 2%. You can see the top chart shows that the headline rate is sitting at 3.7% and the core on the bottom chart is at 4.13%. So while the longer-term trend has been one of declining, we did actually flatten out in the headline, rate even picked up a little bit over the third quarter, although the core rate has come down a little bit as well.
Graph is for illustrative purposes only.
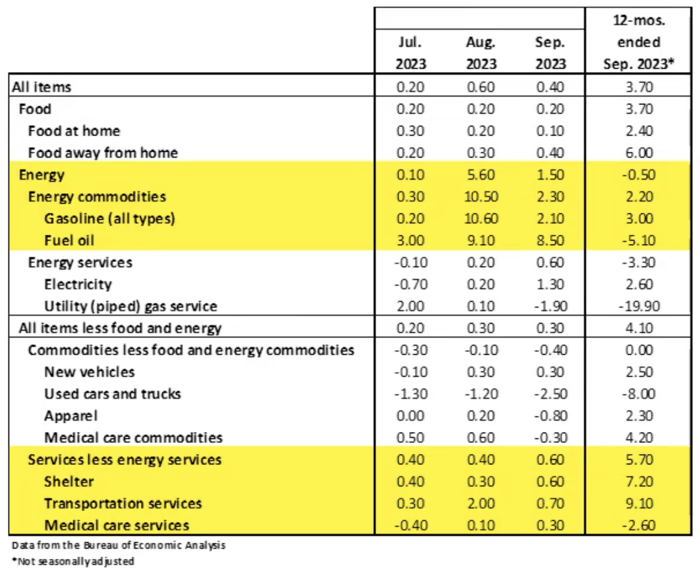
And really some of the drivers to that, when you look at the headline, the reason why that's picked up a little bit over the third quarter, again goes back to the increase in oil prices and gasoline.
If you see the top highlighted yellow portion on this table, that's the energy section. For the last several months, energy's actually been helping bring down inflation. But starting in August, you can see that spike in both gasoline and fuel oil, and energy as a whole.
So that's really turned from helping bring inflation down to having the opposite effect and driving that up a little bit.
On the core area, most of the core commodities are looking very good. They're starting to come back, particularly in the used cars and trucks area, but core services continue to be sort of that sticking point. You can see shelter is still very strong, and in fact, in September, each of these areas ticked up a little bit.
Federal Reserve Policy
Matthew Harbert (11:08)
Graph is for illustrative purposes only.
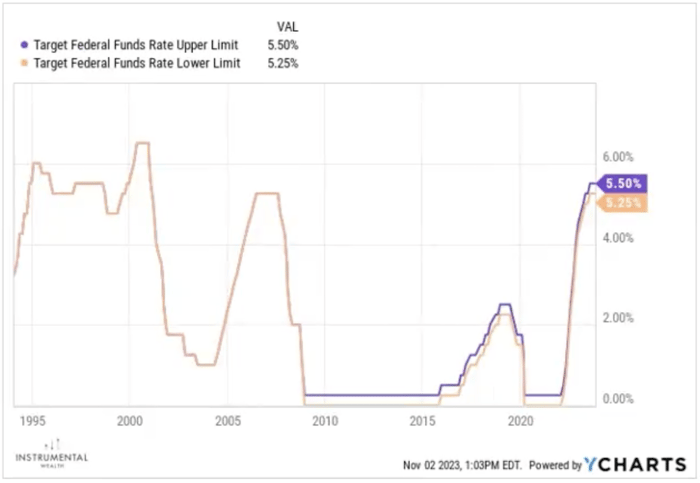
And that leads to the Federal Reserve policy. So, kind of recapping what they've been doing, starting in early 2022, the Fed's been on this drastic tightening schedule to combat what they felt was inflation getting out of control.
During that period, they raised rates 525 basis points, but we think that they're actually at the end of their tightening cycle at this point. They've only hiked once over the last four meetings and they've been on pause the last two.
In addition to that, their comments have really shifted a little bit. Previously they were extremely hawkish and they've kind of moved over to just sounding a little bit more cautious with their guidance that they've moving into this data dependency.
So going forward, they're really going to be looking at the data to determine how they should adjust rates, but they have made it very clear that they haven't ruled out an additional rate hike before the end of the year if either the economy or inflation just heats up a little too much.
The Big Question on Recession
Matthew Harbert (12:22)
So looking forward, really the big question is a recession coming soon?
And interestingly, we got the recent GDP rating for the third quarter, which ended up surprisingly strong, came in at 4.9%, which was over double what we had in the second quarter at 2.1%.
But growth continues to be driven by strong consumer spending. And we've been talking about this for several quarters. It is surprising given that consumers are facing such high interest rates and high prices, but they keep dipping into the same two sources that have allowed them to keep spending.
Excess Savings
Matthew Harbert (13:14)
Graph is for illustrative purposes only.
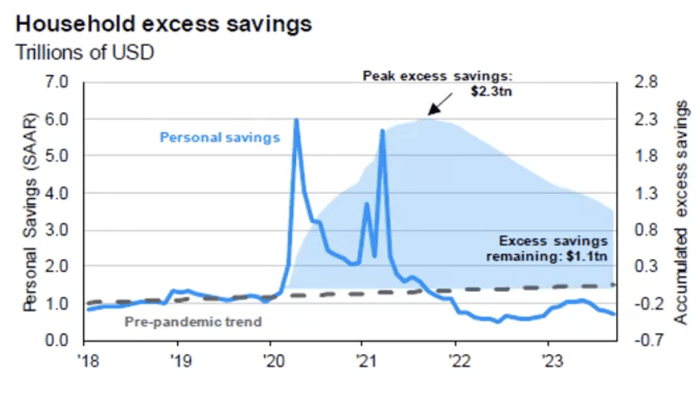
And one of those is excess savings. Consumers built up quite a bit of excess savings while they were quarantined at home. That peaked up at about 2.3 trillion of savings. And we can see since then they've been chipping away at that. It's now sitting at about 1.1 trillion. So they've spent over half of their excess savings that they had available to them, and that's the blue mountain chart that you see on this graph.
And the blue line chart, that's the personal savings. So you can see that that personal savings rate is actually declining as well. So they're chipping into their personal savings and the savings rate is actually negative at this time. So that is obviously something that's only really a temporary source until they deplete that.
Heavy Borrowing
Matthew Harbert (14:13)
Graph is for illustrative purposes only.
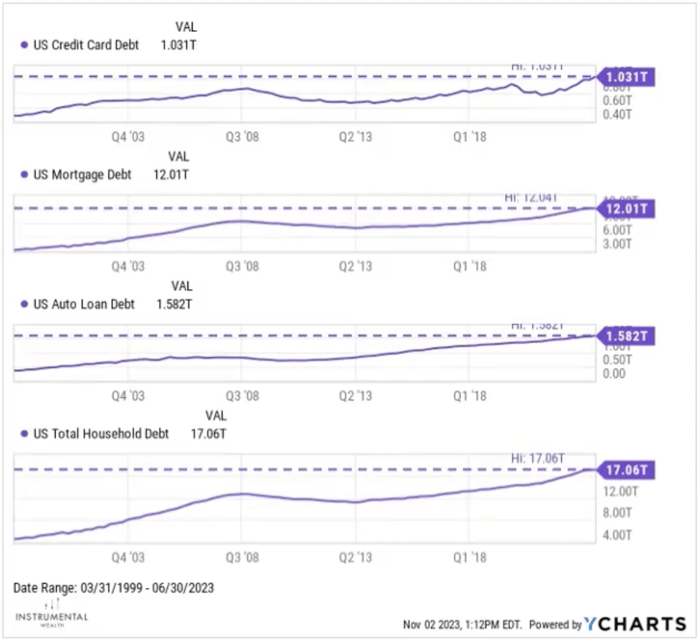
The other thing is they've turned to heavy borrowing as well, and we can look at several metrics to really see this. So you can see the US credit card debt has hit a record high of $1 trillion.
Mortgage debt is sitting at 12 trillion, auto loan debt at 1.5 trillion and total household debt sitting at over 17 trillion. All of these are records as well.
Headwinds to GDP Growth
Matthew Harbert (14:50)
And as far as getting back GDP a little bit as far as growth, we do actually see some headwinds to this growth.
On the demand side, we do have higher oil prices and as we've talked about, interest rates are also high as well. So both of those are headwinds to the consumer. On the supply side, we're having that slowing down of a labor market a little bit. And then housing, we are in that housing correction that's facing the higher mortgage rates and continued high prices as well.
Traditional Predictors of a Recession
Matthew Harbert (15:30)
Graph is for illustrative purposes only.
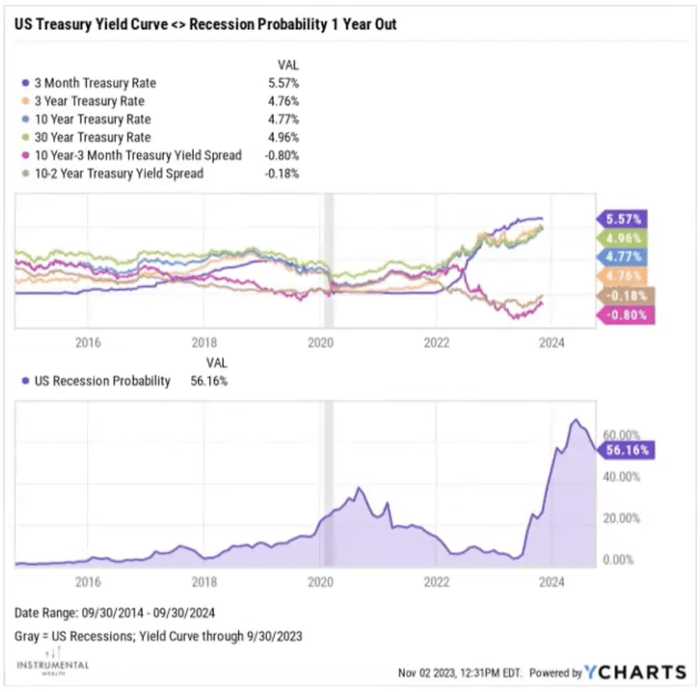
Lastly, we can look at some of the traditional predictors out there. One of those is the yield curve. So the yield curve has actually been inverted for quite some time.
You have the 10-year to three-month yield curve, and that's been inverted for 12 months. And then you have the 10-year to two-year, and that's been inverted for 16 months.
And generally we look at when a yield curve inverts. It typically suggests that a recession could be coming sometime over the next 18 to 24 months. And as you can see, the 10 to two year at 16 months, we are creeping up on that pretty soon.
And if you look at the bottom chart, this is actually something called the Estrella and Mishkin probability chart. So it's essentially using the data of the yield curve and it is predicting it's giving a probability of a recession a year out from now.
And that on June 30th actually hit the highest it's been since the 1980s. It hit 67.3, although over the third quarter you can see it's been trending back downwards where it's at 9/30, it's sitting at basically about 56%.
So essentially this is predicting with 56% probability that sometime in the next year we could have a recession.
Leading Indicators of a Recession
Matthew Harbert (17:30)
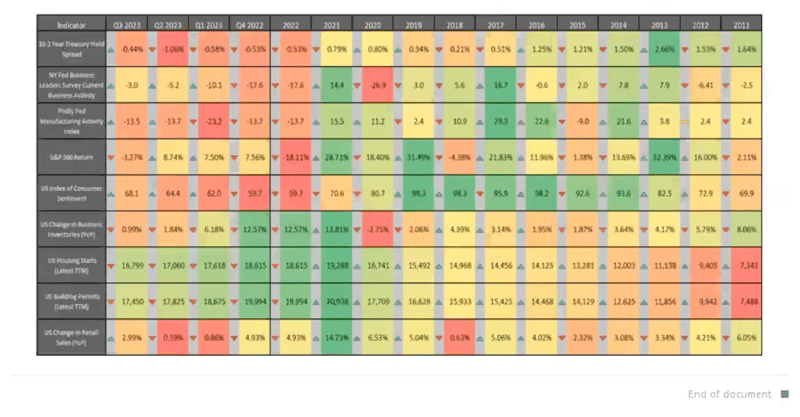
Graph is for illustrative purposes only. For context, the chart is color coded on a spectrum from green to yellow to orange to red. Yellow to green means a recession is less likely, and orange to red means a recession is more likely.
Some of the other things that we look at are leading indicators. This table is a heat map of various indicators that are considered leading indicators of the economy.
If you read this kind of right to left, you can get a sense of how we're moving out of the green and yellow into more yellow, orange and red. So that's kind of showing that these indicators are starting to deteriorate a little bit and they are starting to flash that there could be a recession coming.
I'd say overall these are sort of mixed.
Positive Signals:
- The year over year retail sales did grow at 3%, so that remains strong and positive.
- Consumer sentiment did rise by 3.7%, so that improved a little bit.
Negative Signals:
- We already talked about the 10 to two year treasury yield curve is heavily inverted.
- We've got some of the Federal Reserve indexes, the Philly Fed Manufacturing and the New York Fed current business activity have remained negative.
- And then lastly, you've got building permits and housing starts, which are green, but you can see that it's gone from heavy green.
It's been sort of trending down towards the lighter green as we've been in that sort of correction period. And it's actually fallen. Those each have fallen for the last four quarters.
So these indicators are really kind of hinting that we're going to start having some slower growth, maybe even negative growth going forward.
Probability of a Recession this Year
Now, while we do see several headwinds to growth, we don't think that there actually is a high probability of a recession this year. As long as the consumer continues to spend, it should stay positive.
However, as we mentioned, some of those areas that they're able to tap into in order to keep spending at some point, those are going to, they're going to lose access to that and we should start seeing a reduction in spending.
There are also several tailwinds to growth. We are at the end of the Federal Reserve's tightening cycle, so that should start easing some pressures on consumers and businesses as well.
And lastly, as employment is normalizing, it is still solid. So the employment market is still pretty robust.
So we do think we're not going to end up in a recession by the end of this year.
Probability of a Recession in 2024
In 2024, we are seeing, as we mentioned, some of the indicators pointing out that there is a likelihood we could get into a recession at that time.
We might put maybe a 50-50 chance of a recession in 2024, however, there will be a recession at some time so that probability the longer we go out gets a little bit higher.
So if we don't see a recession by the end of 2024, the probability that we get one in 2025 increases pretty significantly.
Other areas, inflation, we continue to believe that the CPI will be around 3 to 3.5% by the end of the year. We actually fell below three and a half percent in the second quarter, but as we saw, it's uptick a little bit in the third quarter given some of the increase in oil prices. But we do believe it's going to remain about three to three and a half percent by the end of the year.
Obviously, if we did manage to get into a recession, that would put additional press downward pressure on prices. But as we mentioned, we don't think that's a very high probability.
And then what do we think the Federal Reserve is going to do? We do think the Fed is at the end of their tightening cycle. It's certainly possible they could raise one more time in December given the economy, if it ends up being very hot or if inflation continues to tick up, it is possible we could see another hike in December, although at this point we think the highest probability is that they're probably done for this year.
And that is the update for the third quarter.
Conclusion & Thank You
David Silver (22:10):
Matt, a lot of great material in here. And again, thank you for walking all of our clients through this. I know that we get so much great feedback from clients being able to have this data presented to 'em in this fashion.
So thank you very much and for all of our clients watching this, if you have questions for Matt or for your advisor, feel free to reach out to us. We'd love to have a deeper conversation with you guys.
And wishing everybody a great start to the fourth quarter here and we look forward to talking with you all soon. Take care.