

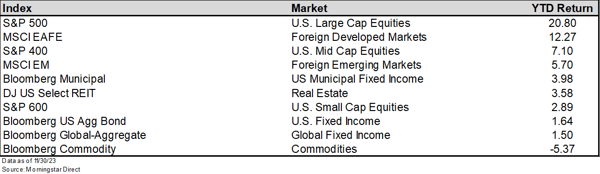
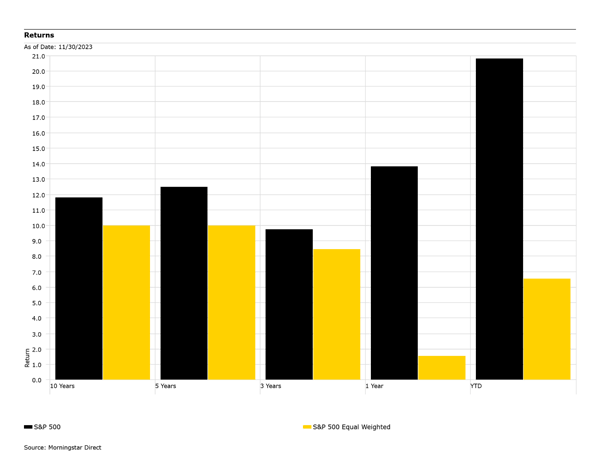
2023 has been a good year for the S&P 500, an index created to benchmark the large cap U.S. equity market. Its performance relative to other major asset classes has been particularly strong with the foreign developed markets being the next best performer, which underperformed the S&P 500 by over 850 basis points through the end of November.
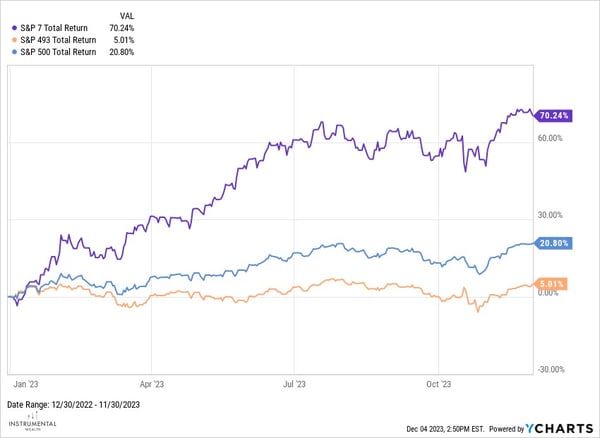
This outperformance, however, overstates the strength of the market as a whole as much of the return can be attributed to seven stocks, Apple, Microsoft, Alphabet, Amazon, Nvidia, Tesla, and Meta, often referred to as the "Magnificent 7". These stocks have yielded a whopping return of 70.24% YTD, significantly skewing the overall index performance. In contrast, the remaining 493 stocks in the index have collectively shown a return of only 5.01%. If not for those 7 companies, the overall broad U.S. large cap market would be right in line with other asset classes.
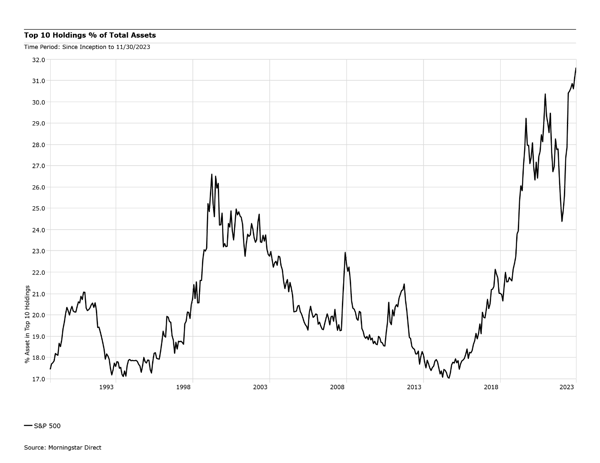
The S&P 500 is a cap weighted index where each company is weighted according to its market capitalization. Market capitalization is calculated by multiplying the current share price of a company by its total number of outstanding shares and companies with higher market caps will have more impact on the index's overall performance. Over the last decade the S&P 500 has become heavily concentrated with the top ten holdings accounting for over 31% of the index and the Magnificent 7 group of stocks alone make up approximately 28%. This puts the index at the highest level of concentration we’ve seen over the last 30 years.
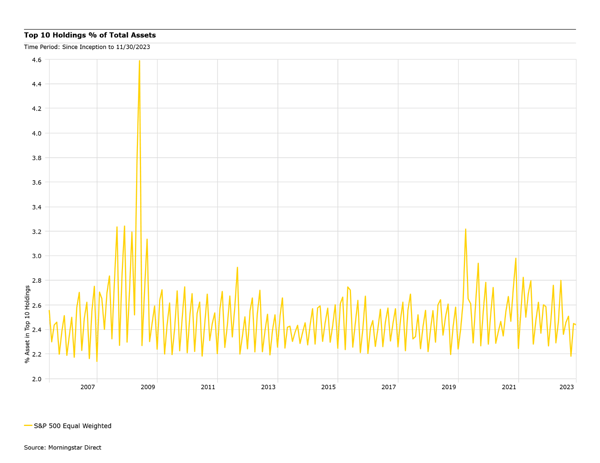
This concentration results in an index far less diversified than intended as the returns will be primarily driven by a small, non-diversified, subset of positions. We can compare this to a different version of the index, the S&P 500 Equal Weighted Index. This version of the index assigns an equal weight to all 500 companies, thereby eliminating the concentration problem of the Cap weighted index. The top 10 assets in this model typically range between 2.2% and 2.8%, keeping it well diversified regardless of the size of each company.
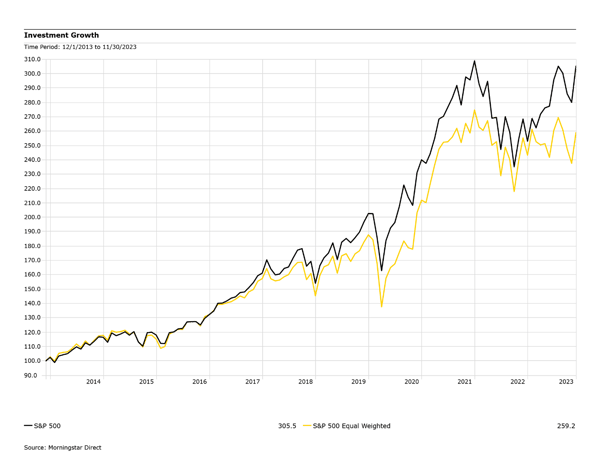
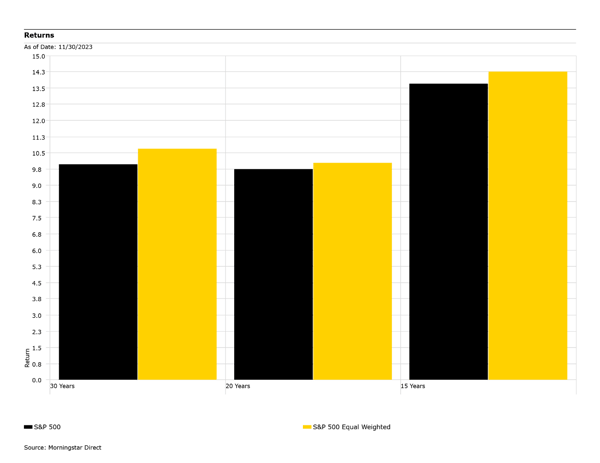
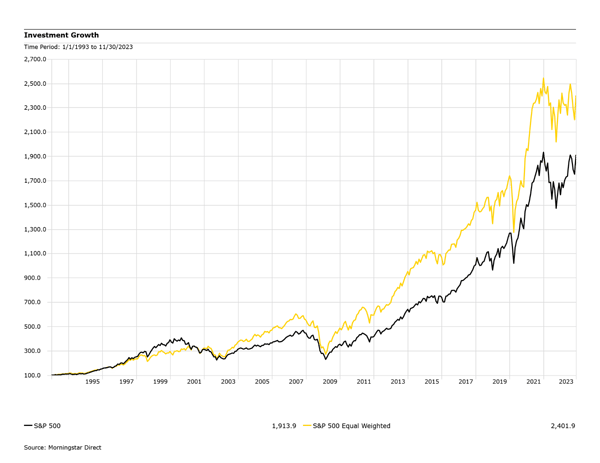
When we compare the performance of the cap weighted index against the equal weighted index, the cap weighted has benefited from the strong performance in the concentrated portion of its holdings. It has outperformed the equal weighted index in each of the trailing periods over that time period. For an investment of $100 in both the cap weighted and the equal weighted index on 12/1/13, the cap weighted would have grown to $305 and the equal weighted to only $259.
While investing in the more concentrated index has allowed investors to benefit from the FAANG and Mag 7 stocks over the past decade, the question is, can this be sustained going forward and does staying concentrated continue to make sense. While we can’t predict exactly what will happen, or when, we can look back to another time when the markets were in a similar situation.
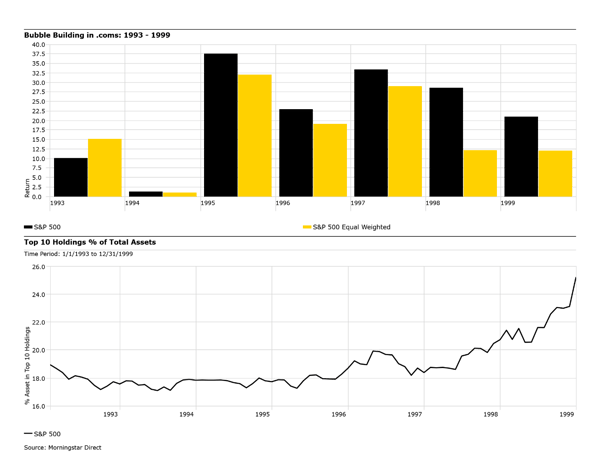
Back in the mid to late 1990’s, the markets were building up a heavy concentration as investors piled into .com stocks. There was a very similar story during this time, the .com businesses significantly outperformed the broader market and drove up the concentration of the cap-weighted index. The oversized impact of these firms allowed it to outperform the more diversified equal weighted portfolio, in fact it outperformed every calendar year between 1994 and 1999.
Unfortunately, this was not a sustainable situation and as the .com bubble started to correct; portfolios concentrated in these high-flyers started underperforming. This resulted in a period of 14 years where the more diversified, equal weighted index outperformed the cap weighted index.
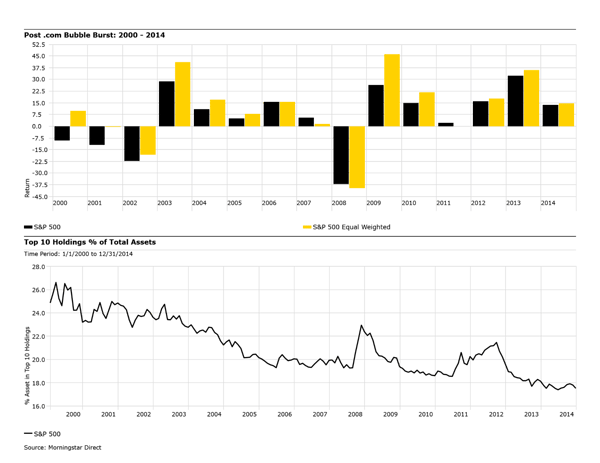
As we look over the past 30 years, the market has experienced two periods (1993 – 1999 & 2014 – present) where the index was heavily concentrated and outperformed the more diversified equal weighted index. It also went through a prolonged period (2000 – 2014) where valuations were normalizing, and the previous concentrated positions were a detriment to the portfolio resulting in the outperformance of the diversified portfolio.
Over this period would investors have been better off taking on the more concentrated portfolio or diversifying? Comparing the two versions of the index implies a diversified portfolio held over the full period would have outperformed a concentrated portfolio as the equal weighted outperformed over the past 15, 20 & 30 year periods. For an investment of $100 in both the cap weighted and the equal weighted index on 1/1/93, the cap weighted would have grown to $1,913, lagging the equal weighted which would have grown to $2,401.
While this is a simple example looking at only the U.S. large cap equity markets, the concept also applies to a broader portfolio and diversifying out to multiple asset classes.
The following chart breaks down the calendar return of each of the broad asset classes going back 30 years, including a portfolio that is diversified into each asset class at a 70% equity and 30% fixed allocation. This shows how unstable each asset class is, as many asset classes will frequently move from one of the highest performers to one of the lowest. For example, U.S. large caps were one of the better performers during the .com buildup phase and outperformed the 70/30 portfolio, but as it corrected, it generally underperformed over the following decade.
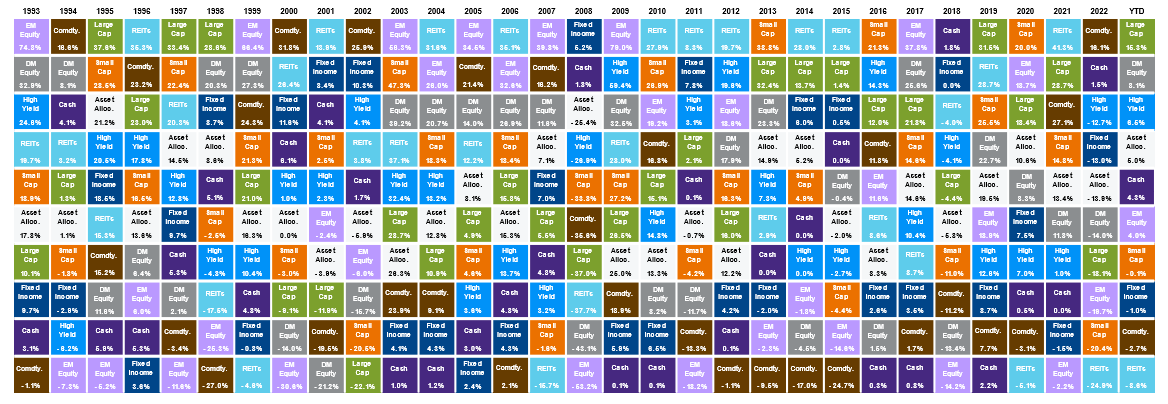
It is helpful to understand that the purpose of diversification in a portfolio is not to chase the highest returns but to manage risk effectively. The goal is not to bet on the best handful of positions but to achieve investment goals with minimal risk, providing a buffer against market volatility and concentration risks. We can see this in the previous chart as individual asset classes move from top performers to bottom performers frequently, the 70/30 portfolio is quite stable providing a much more predictable return. While the recent performance of the S&P 500, driven by a few dominant stocks, has been impressive, a longer-term perspective underscores the value of diversification in achieving sustainable investment success.